SKILLS AND TECHNOLOGIES
Full Stack Web Developer
Python, TensorFlow, Scikit-learn, PyTorch
Java, C++
HTML, CSS, Bootstrap
JavaScript, Typescript
Node.js, Angular
Three.js
MongoDB
MySQL, PostgreSQL
Git, GitHub
EDUCATION
Brooklyn College, CUNY — GPA: 3.88
Bachelor of Science in Computer Science
2019 - 2021
Relevant Coursework
Database Systems
Data Structures
Analysis of Algorithms
Machine Learning
Programming Languages
Computer Graphics
University of the Arts London
Master of Arts in Fashion Artefact
2012 - 2014
WHAT HAVE I BUILT?
Using three.js built a data visualization app which explores the trend in global land temperatures.
This project explores data parsing and visualization in Three.js. JSON and CSV data files are used to create visual representations of Global Land Temperatures data in a web browser using Three.js. dot.GUI control with dropdown allows the user to change the year to see the average temperatures in the cities in a certain year.
https://threejs-data-visualization.herokuapp.com
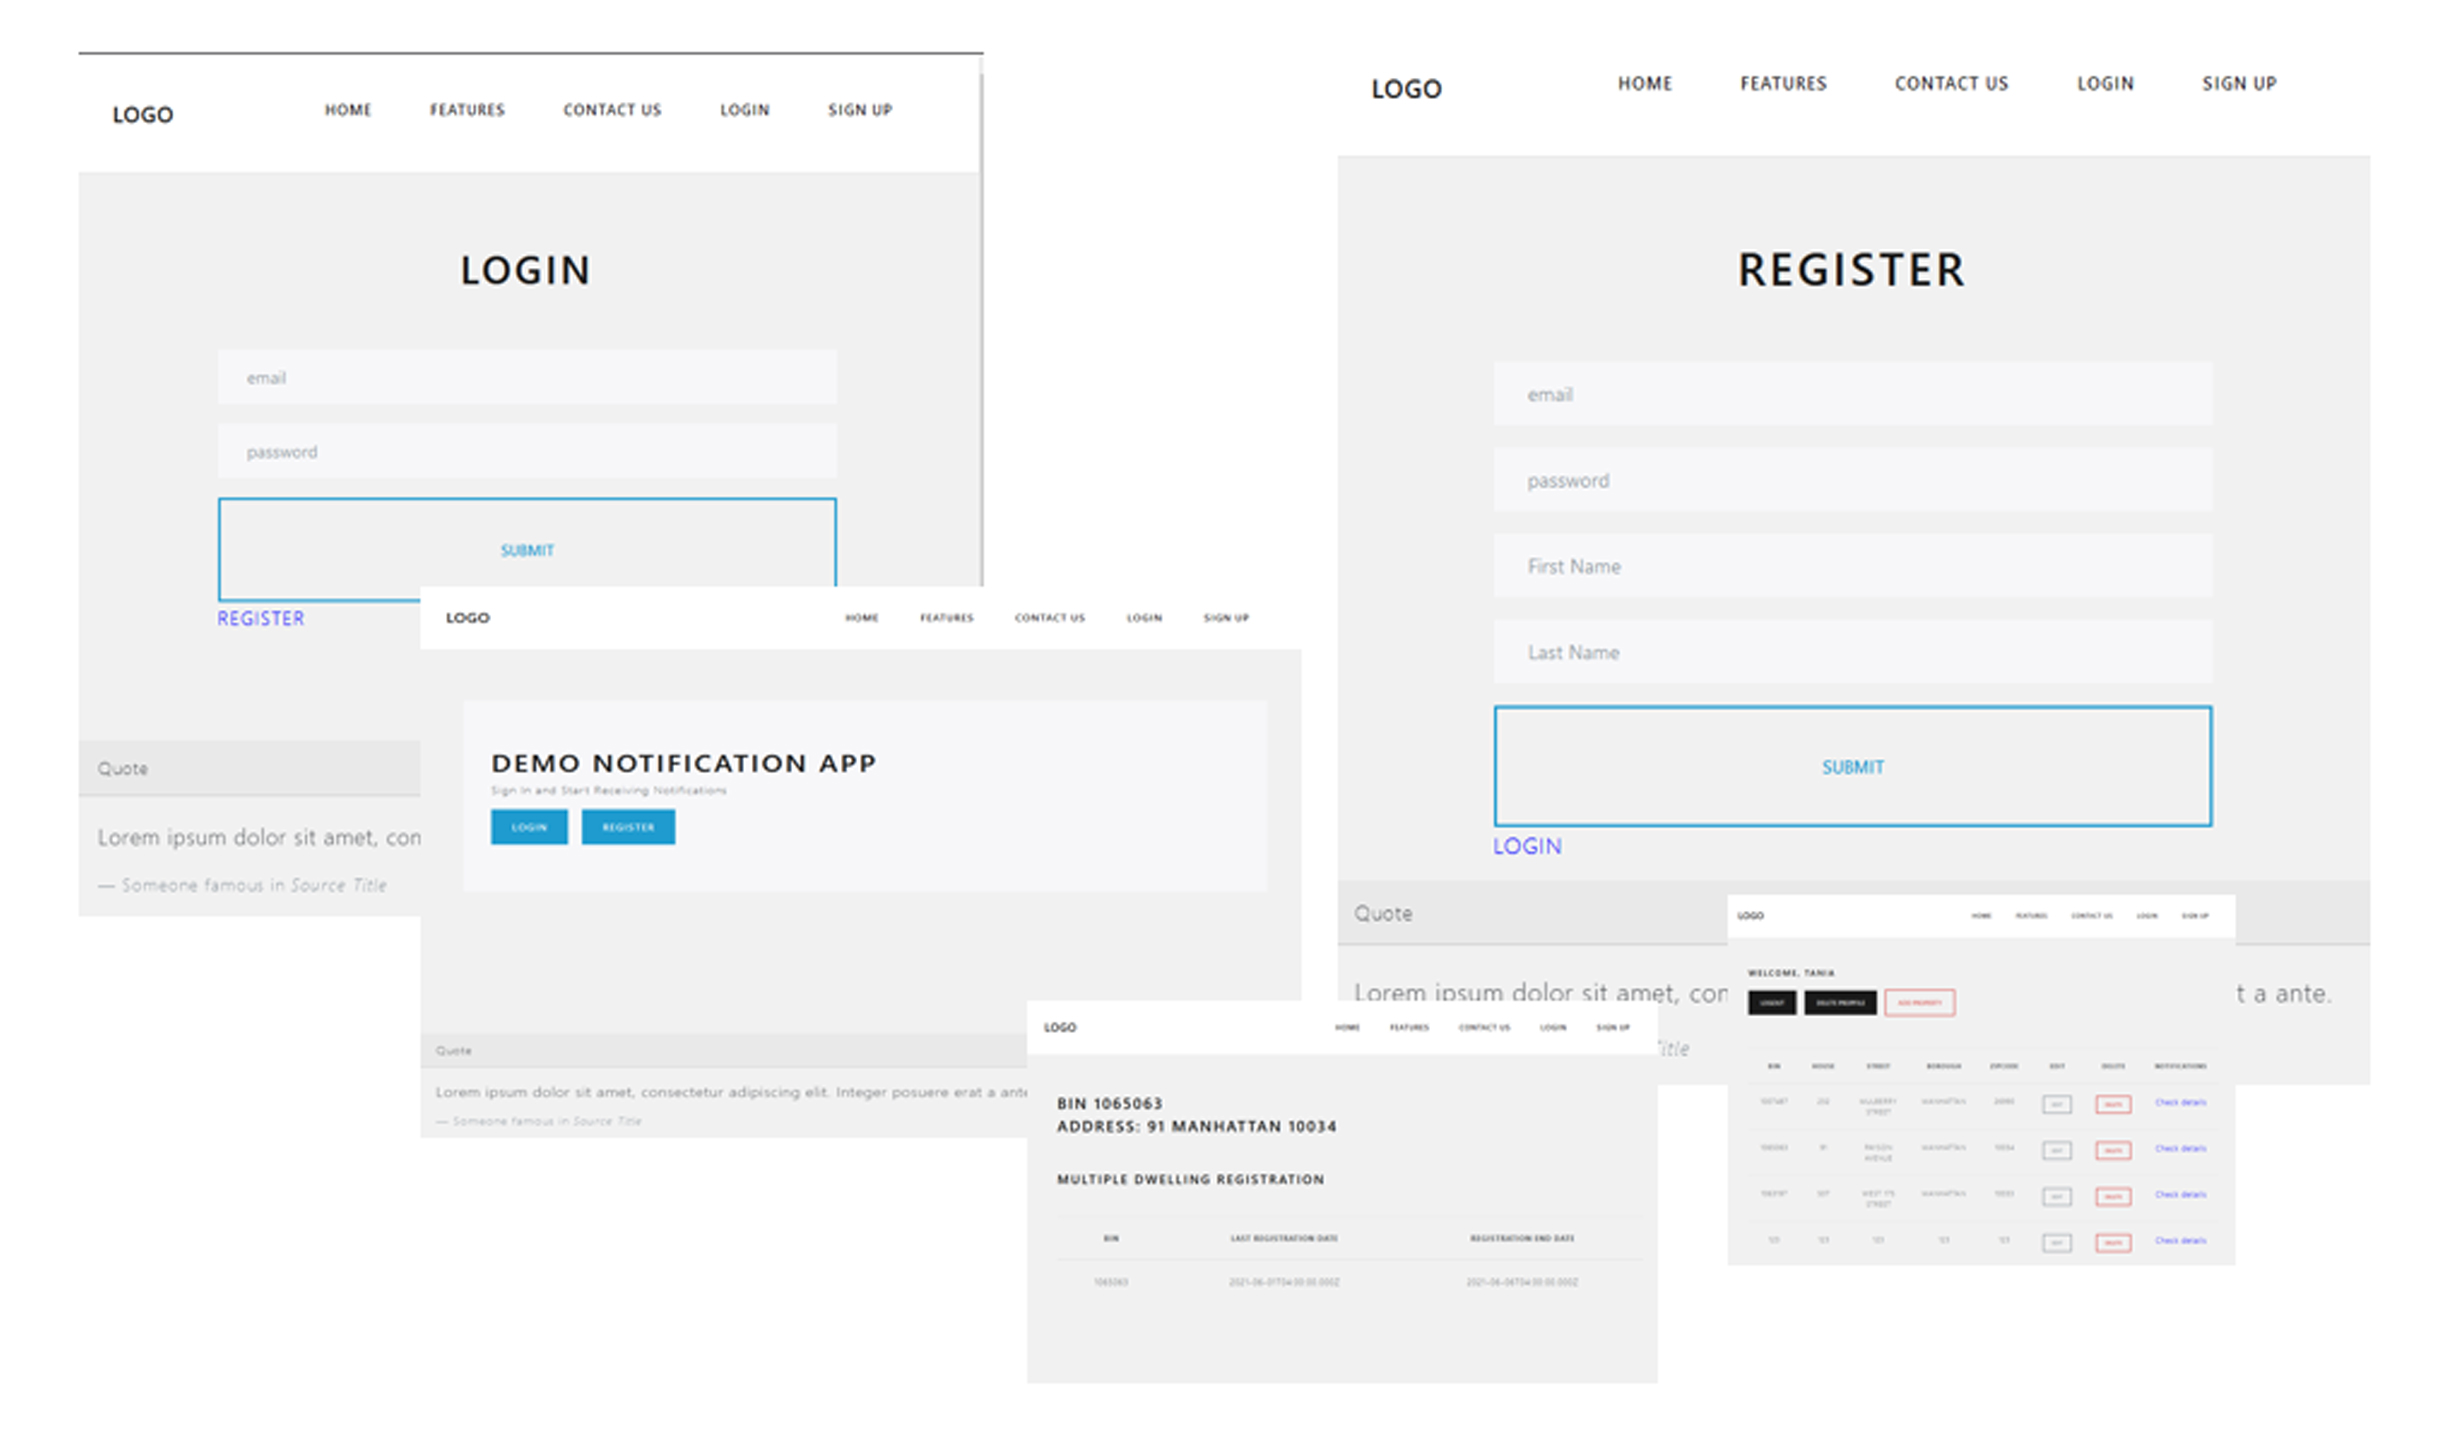
Using PERN stack: Postgres, Express, React, Node.js. built The Notification app which daily retrieves data on properties registration expiration dates and sends email reminders to users.
The application allows the user to create a profile, login, add properties to the profile, edit them in dashboard and receive reminders about these properties’ registration information.
Server functions include CRUD operations on each database table, user authentication and authorization, getting updates from external sources daily, saving data to json files, updating database daily, sending emails with updates to users.

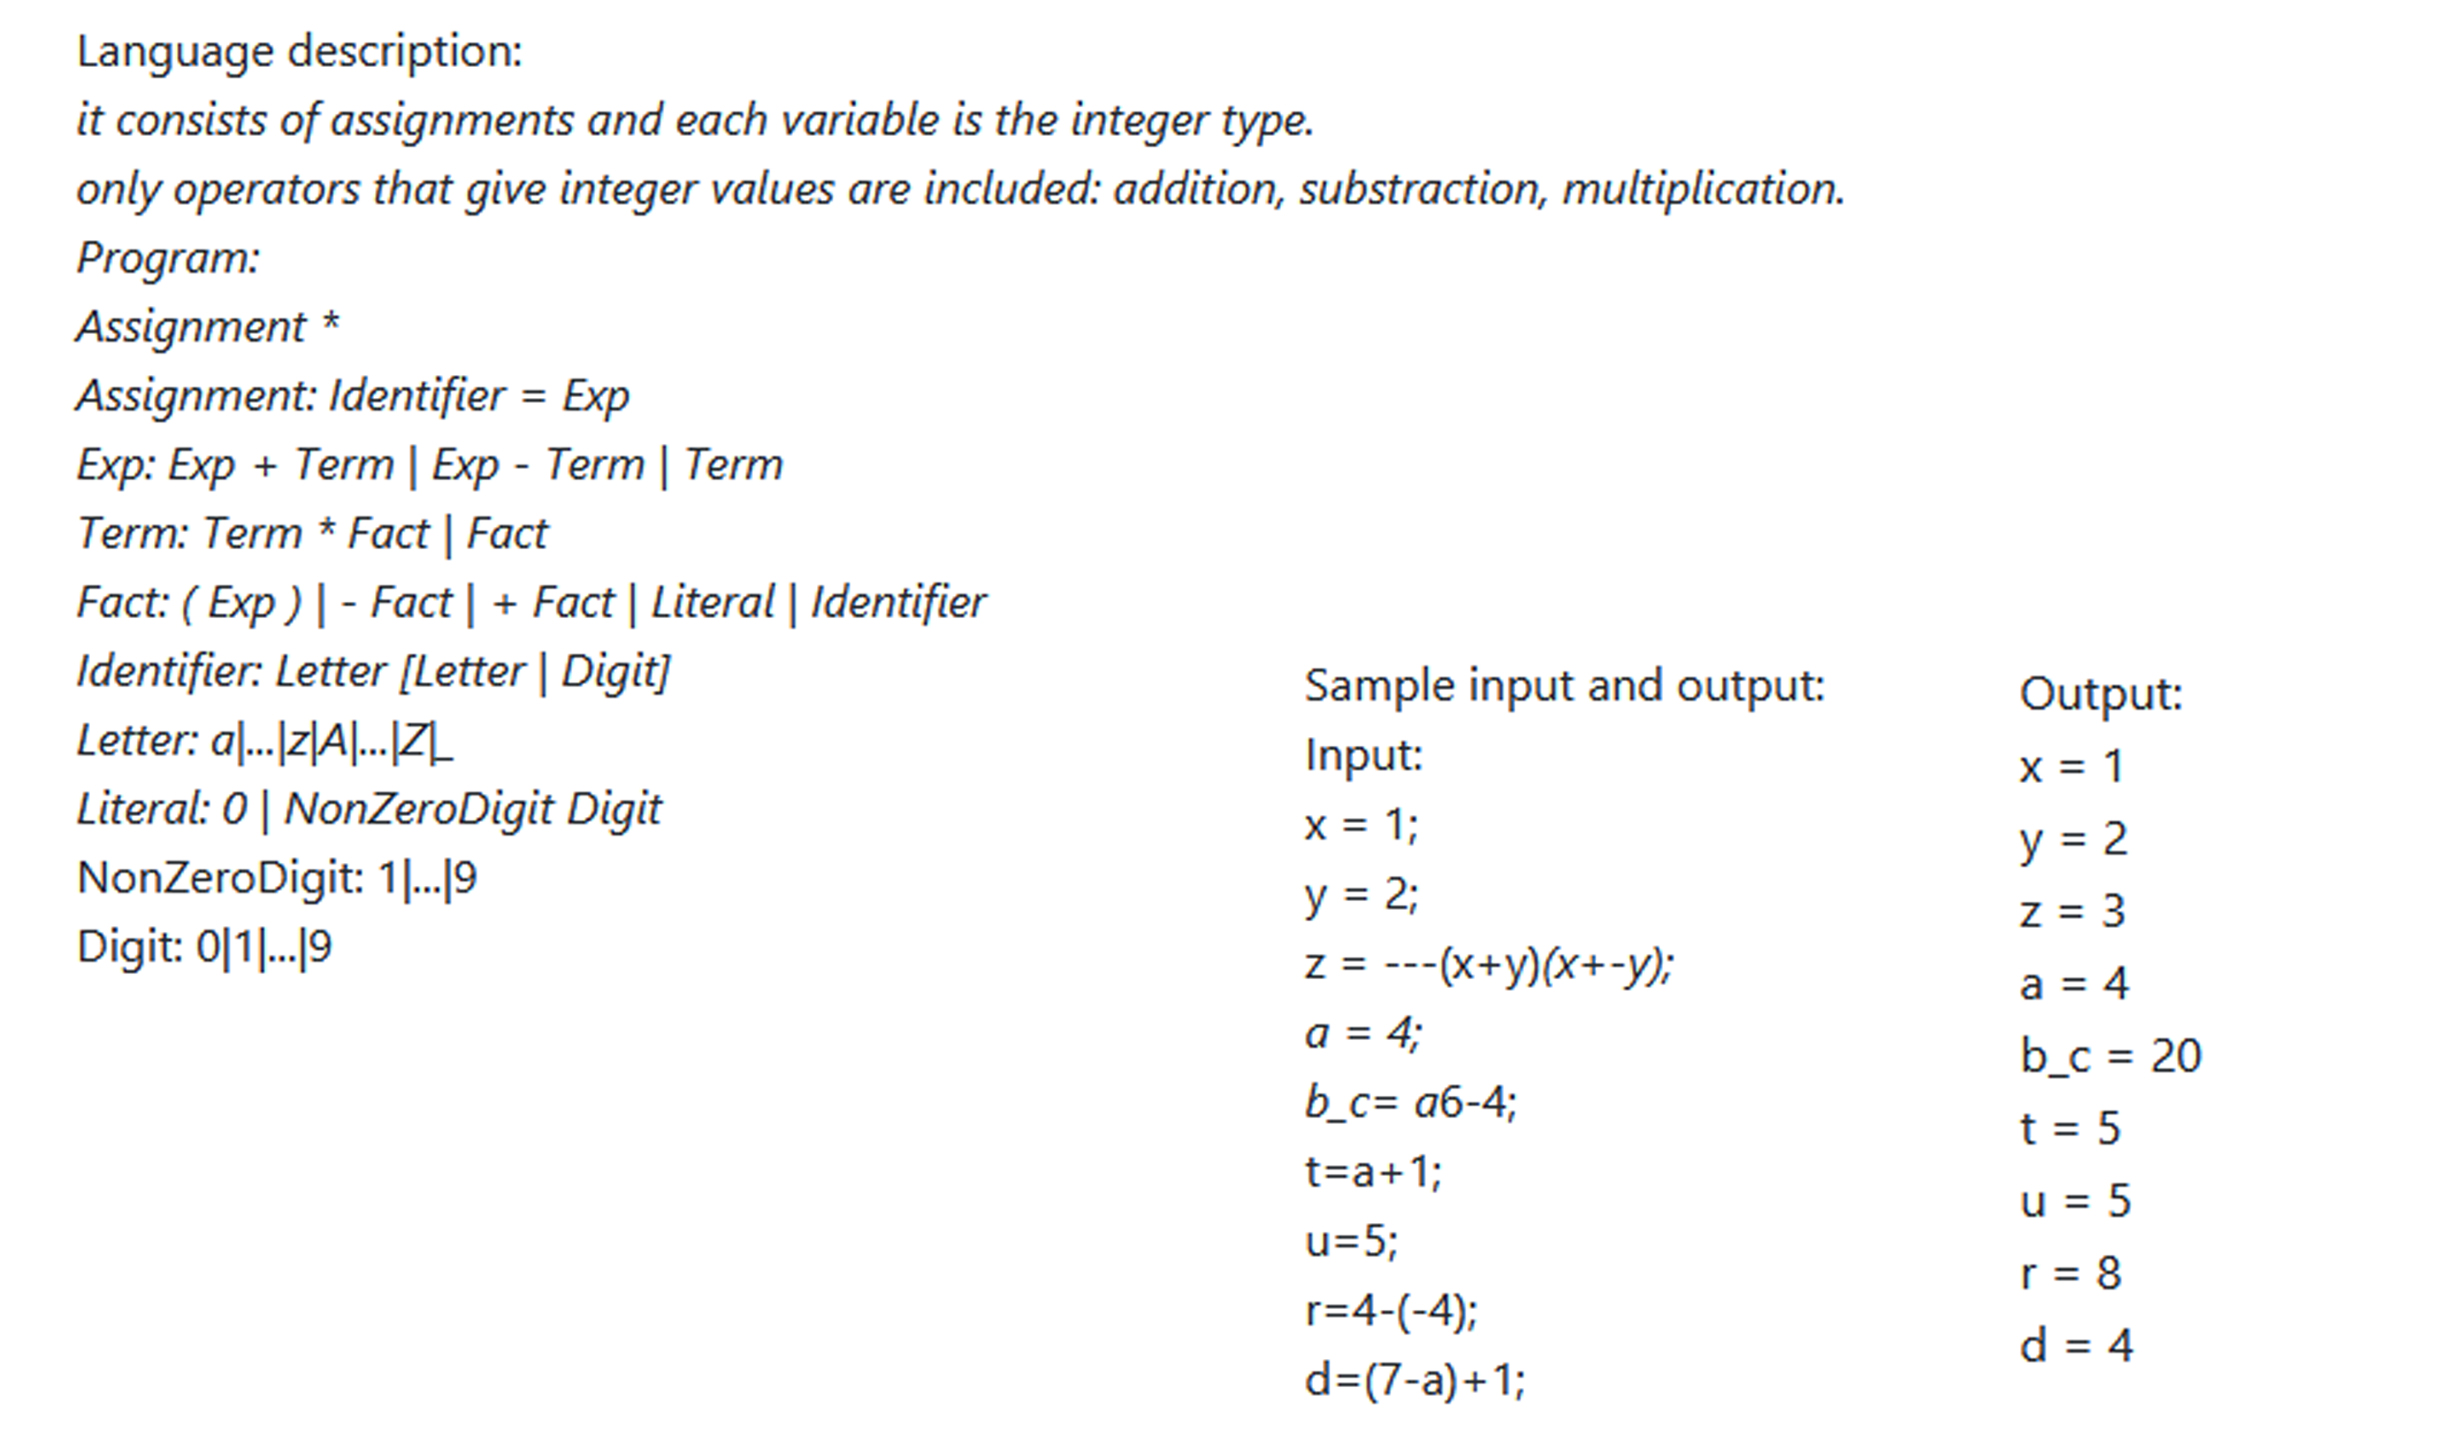
Built a java interpreter for a toy language that consists of assignments. The interpreter detects lexical and syntax errors, reports uninitialized variables, and performs the assignments.
https://github.com/tatianaazulay/java-interpreter